Reading the Sewage Signal: A Realistic Guide to England’s Winter 2026/27 Wastewater Watch
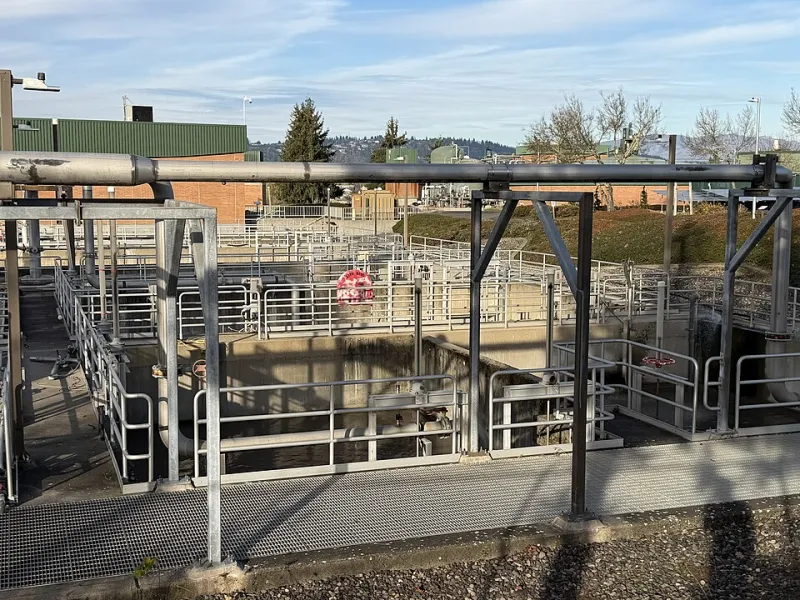
Photo: PortlandAppraisalBlog, CC BY-SA 4.0, via Wikimedia Commons
Wastewater surveillance has become one of the quieter fixtures of England’s public health infrastructure. Samples drawn at treatment works are analysed for fragments of respiratory and gastrointestinal pathogens, and the results are published as trends rather than diagnoses. As the 2026/27 winter season begins, the temptation is to treat those curves as a ready-made dashboard for local action. The reality is more modest—and, handled well, more useful. Wastewater is a population-level signal that works best when read alongside clinical, laboratory and epidemiological data.
What the signal can and cannot show
At its strongest, wastewater monitoring detects changes in community infection before or alongside clinical testing. That is valuable because clinical testing is uneven. People with mild illness may not seek care, access to testing varies, and reporting behaviour shifts with public messaging and seasonal pressure. Wastewater sampling can sidestep some of that bias because it does not depend on an individual choosing to be tested.
But the signal is not a count of infected people. A positive detection means that genetic material from a pathogen has been found in a sample. It does not tell public health teams how many people are infected, how severe their illness is, or whether a particular variant is driving a local increase. Shedding patterns differ between pathogens and between individuals. Some people shed more viral material for longer; others shed little. Wastewater can amplify the contribution of a small number of high-shedders, and it can dilute a genuine rise when flows are high.
For local public health teams, the practical question is not whether a pathogen is present. It is whether the trend is credible enough to prompt further investigation. That requires a disciplined reading of the data rather than a headline response to the latest sample.
Normalisation is not a technical footnote
Raw wastewater concentrations are difficult to interpret because the amount of water flowing through a treatment works changes constantly. Rainfall, groundwater infiltration, industrial discharges and seasonal population movement all affect dilution. A rise in pathogen concentration may reflect more infection, but it may also reflect less flow.
This is why normalisation matters. Laboratories and analysts use flow data, population estimates and faecal indicator markers—such as crAssphage or pepper mild mottle virus—to adjust for dilution and sampling variability. Done well, normalisation makes trends more comparable over time. Done poorly, it can create a false sense of precision. No single correction factor removes all uncertainty, and different normalisation approaches can produce slightly different pictures.
For readers of surveillance reports, the lesson is to look for consistency. Is a rise seen across multiple sites and across several sampling runs? Does it align with clinical data, such as laboratory-confirmed cases or NHS pressures? Is the increase large relative to the recent baseline, or is it within the noise of the method? A single elevated sample is a prompt to look closer, not a conclusion.
Resolution, timing and the local question
England’s wastewater programme operates at a scale that can support national trend analysis, but local interpretation is more demanding. Sewersheds do not respect local authority boundaries. A treatment works may serve several towns, hospitals, universities and travel hubs. Samples may be taken weekly or less frequently, and laboratory turnaround adds a lag. By the time a trend is published, the local picture may already have moved.
This does not make the data unusable. It means local teams must be honest about what they can infer. Wastewater can support situational awareness, help prioritise scrutiny of clinical data, and provide an early warning that something is changing. It cannot, on its own, identify a hotspot in a specific care home, school or hospital ward. That requires targeted sampling, epidemiological investigation and clinical confirmation.
The 2026/27 winter will test this distinction. Respiratory viruses and gastrointestinal pathogens do not rise in neat isolation. Norovirus, influenza, RSV and other seasonal infections may co-circulate, and clinical testing priorities will shift as NHS services come under pressure. Wastewater can show that multiple signals are moving at once, but it cannot explain why. Local teams will need to combine it with outbreak reports, syndromic surveillance and laboratory data before drawing operational conclusions.
Communication: uncertainty without paralysis
Wastewater data are easy to miscommunicate. A statement that pathogen levels are rising may be technically true but practically misleading if the rise is small, short-lived or within normal seasonal variation. Conversely, over-caution can erode trust if every fluctuation is presented as a warning.
Good communication should state the trend, the timeframe, the geographic scale and the main caveats. It should explain that wastewater surveillance is a complement to clinical surveillance, not a substitute. It should avoid implying individual risk from a population sample, and it should make clear when a signal is being investigated rather than confirmed.
For Pathogen Solutions readers, the most useful framing for winter 2026/27 is triangulation. Wastewater is one line of evidence among several. Its promise lies in early detection and trend monitoring; its blind spots lie in normalisation, sampling resolution, shedding variability and the gap between environmental detection and clinical disease. Read with those limits in view, the sewage signal is a valuable public health tool—not a verdict.
What to watch this winter
The coming months will show whether the programme can maintain consistent sampling through cold weather, staffing pressures and seasonal demand. Local public health teams should watch for sustained changes across multiple sites, alignment with clinical indicators, and any divergence between wastewater trends and laboratory-confirmed cases. Those divergences are not failures. They are exactly the points where further investigation is needed.